The use of RWE has evolved and broadened rapidly over the last few years.
For a long time, most real-world evidence work sat in a narrow window around launch. Budget impact, post-marketing safety commitments, risk-sharing agreements: the questions were mainly about getting a product reimbursed and keeping it reimbursed through the first years on the market.
That window has widened at both ends.
Payers now expect real-world data long before a product reaches the market, and they ask again every time something changes: a pricing review, a new competitor, a line extension, the first generic.
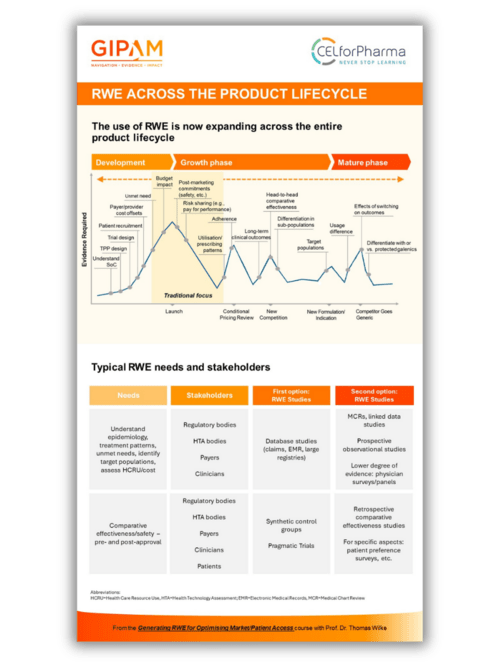
Prof. Dr Thomas Wilke mapped this in a single graphic for the participants of his 1-day course Generating RWE for Optimising Market/Patient Access.
It plots the evidence required at each point in a product's life, names the stakeholder asking for it, and pairs each need with the study design that answers it.
Before launch, the questions are about the market, not the product
In the development phase, the evidence requirement climbs steadily. It begins with understanding the standard of care, and feeds directly into target product profile design and trial design, where real-world data on treatment patterns shows what the comparator should be. It continues into patient recruitment, where claims and registry data show where eligible patients are actually treated. Towards the end of development it turns commercial: payer and provider cost offsets, and the size of the unmet need.
This evidence describes the space your product will enter, rather than the product itself. That is why the work has to begin years before anyone asks the question, and why the data sources you set up in this phase determine what you are able to answer later.
Launch is where the effort has traditionally concentrated
The graphic marks a band around launch as the traditional focus, and the curve peaks there. Budget impact for the payer submission. Post-marketing commitments on safety. Risk-sharing arrangements such as pay for performance. Then, once the product is in use, utilisation and prescribing patterns, and adherence.
Four more peaks, four different triggers
The requirement falls back after launch, then rises again at every event that reopens the discussion about value.
Conditional pricing review.
Payers who granted access on the strength of trial data now want long-term clinical outcomes from routine practice.
New competition.
The question moves to head-to-head comparative effectiveness, and to differentiation in the subpopulations where your product performs better than it does on average.
New formulation or new indication.
Target populations have to be defined again, and the usage differences between formulations become the evidence base.
Competitor goes generic.
The discussion turns to the effects of switching on outcomes, and to differentiating with or against protected galenics.
Each of these is a separate question with its own deadline, and none of them can be answered quickly if the data source was not prepared in advance. A retrospective database study takes months to design, obtain access for, and analyse. The trigger events, by contrast, arrive on someone else's schedule.
The same evidence, different audiences
Across the whole lifecycle, two needs recur.
The first is to understand epidemiology, treatment patterns and unmet needs, to identify target populations, and to assess healthcare resource use and cost. Regulatory bodies, HTA bodies, payers and clinicians all draw on this.
The second is comparative effectiveness and safety, both before and after approval. Here the audience is wider by one group: patients. That single addition changes how a study has to be designed and which endpoints carry weight, because a payer and a patient do not judge a difference in outcome the same way.
What is in the infographic
The full evidence curve across development, growth and mature phase, with 18 evidence needs plotted against the milestone that triggers them
The five trigger points marked on the timeline, from launch to competitor goes generic
A table pairing RWE needs with their stakeholders and with the study design that address them, given as a first and a second option
One page, formatted for printing or for sharing with your team
Download the infographic
Who made this graphic
Prof. Dr Thomas Wilke has directed real-world evidence studies across Europe for more than 25 years, covering database analyses, linked data studies, medical chart reviews and surveys. He heads the university-affiliated IPAM institute and works as a senior scientist at GIPAM, a European RWE consultancy. He has published widely on the subject.
He has been a CELforPharma faculty member since 2023. Participants consistently name the clarity of his teaching and the practical, pragmatic way he handles methodology.

Continue your learning from Thomas
If you’d like to learn more from Thomas, CELforPharma also offers a 1-day, hands-on course where you'll:
- Understand the full spectrum of RWE study types and data sources
- Learn how RWE can support payer, HTA, and access decision-making
- Gain insight into study design and statistical considerations
- Exchange experiences through expert-led discussions and practical examples
Generating RWE for Optimising Market/Patient Access
With Prof. Dr Thomas Wilke

Don’t miss the latest insights from our expert faculty
Subscribe to our newsletter to:
- Stay on top of the latest expert insights
- Receive invitations to upcoming educational webinars
- Get updates on our courses and training programmes