By Gary Johnson, expert-trainer of The Pharma Forecasting Course.
Conjoint analysis assumes that products have different levels of performance on key product attributes. So, for example, one key attribute for a cancer product would be patient median overall survival. And, levels of performance could be 6 months, 9 months, 12 months.
A conjoint questionnaire (and subsequent statistical analysis) uncovers the utility associated with each of these levels of performance. There will be a unique utility associated with each level of performance on all of the attributes studied. The overall “likeability” of any specific product profile is then estimated by adding together the utilities associated with that product's performance level on each of the attributes. This total utility can then be compared to the total utility for any other profile.
But how do total utilities relate to market shares? It is sometimes mistakenly stated that they cannot be directly linked to market shares. However, this is incorrect. Of course, conjoint total utilities cannot provide anything like perfect market share forecasts – because nothing can. However, total utility scores are proportional to market shares – they are just not directly proportional.
Let us take, for example, the utilities obtained from the simplest type of conjoint (so-called self-explicated conjoint). If we create conjoint market share predictions (which are known as preference shares) by assuming that market shares are directly proportional to total utility scores, we get market share predictions that are too “flat”. In other words, the market shares are more similar than real-world market shares – and so inferior products shares are not low enough and superior products shares are not high enough. However, if we “transform” the share estimates by applying an “elasticity” (which allows us to exaggerate the differences in the shares – so that superior products’ shares increase and inferior products’ shares decrease) we get share forecasts that are no longer too flat. The share forecasts are now “unbiased”. That is not to say that they are perfectly accurate, but that there is no systematic error, just random error.
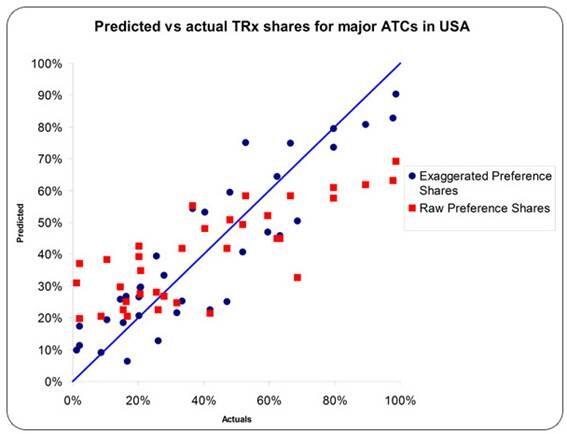
The figure below shows market share predictions for major therapy classes in the USA. The red dots show how predicted shares compare to actual shares when it is assumed that shares are directly proportional to total utility scores. Note that they are too flat when compared to the forty-five degree line (representing a perfect forecast). Note also that the predicted shares, once the appropriate elasticity has been applied (blue dots) is unbiased: the estimates are evenly distributed around the forty-five degree line.
The other thing we have to do is adjust for differences in other key marketing drivers, such as entry order and promotional spend.
🎓 If you want to learn about:
- The six proven principles for producing the most accurate forecasts.
- When and how to use epi-based, patient-based, and sales-based forecasts.
- The evidence-based forecasting techniques for pharmaceuticals and how to use them.
- How to correctly integrate market access into your forecasts.
- How to deal with pharma-specific issues like lines of therapy, co-prescription, etc.
- The future impact of new technologies (e.g., AI and Big Data) on pharma forecasting.
👉 Attend Gary Johnson’s and Sam Johnson’s highly praised 2-day course:
The Pharma Forecasting Course
With Gary Johnson & Sam Johnson

