By Gary Johnson and Sam Johnson, expert trainers of The Pharma Forecasting Course
The level of promotion behind your product is one of the 'big three' drivers of its success. And yet, most marketing managers have been misinformed about the shape of the 'promotional response curve', which is the curve that shows the relationship between your level of promotional spend and your eventual market share.
Most marketing managers have learned that the promotional response curve is S-shaped. In other words, they have been told that there is a 'threshold' below which promotion has very little impact, and above which promotion has a much larger impact. In fact, this was the finding of the first famous study to look into the subject. But, since then, many studies have refuted the S-shaped promotional curve. As a final irony, the author of that first study later reanalysed his data and discovered a mistake - he too had found that the data did not support an S-shaped curve.
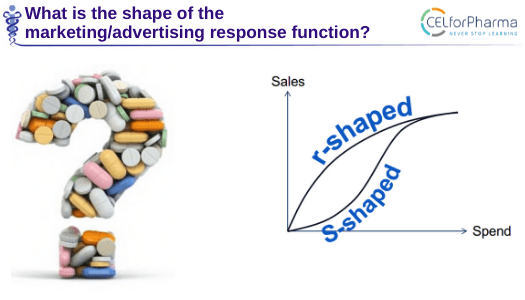
So, what is the shape of the promotional response curve? Most studies suggest that it is r-shaped. In other words, the effect of promotion is subject to diminishing returns: every dollar you spend returns a little bit less than the previous one.
This has important implications for your marketing and your forecasting:
For your marketing: if a promotional approach is not working, spending more to cross a mythical threshold will not work!
For your forecasting: you can quantify the relationship between promotional spend and market share and use this as a powerful forecasting tool. For this you need to know what the 'elasticity' is, i.e. the number that quantifies the shape of the r-shaped curve.
The above insight shows the importance of looking at evidence before drawing conclusions. Attend Gary Johnson and Sam Johnson’s The Pharma Forecasting Course to learn all about the evidence-based concepts, models and techniques that work best to forecast the sales of pharmaceuticals.
The elasticity model, and four other techniques worth knowing:→ The 5 most useful sales forecasting techniques for pharmaceuticals |
Continue your learning from Gary and Sam
If you’d like to learn more from Gary and Sam, CELforPharma also offers a 2-day, hands-on course where you'll:
- Learn the fundamentals of good forecasting and when to apply each approach
- Understand AI and advanced methods without unnecessary complexity
- Apply insights immediately through hands-on exercises
- Learn from experienced experts and peer discussions
The Pharma Forecasting Course
With Gary Johnson & Sam Johnson


Don’t miss the latest insights from our expert faculty
Subscribe to our newsletter to:
- Stay on top of the latest expert insights
- Receive invitations to upcoming educational webinars
- Get updates on our courses and training programmes