By Gary Johnson, expert-trainer of The Pharma Forecasting Course.
Sales forecasting is necessary in a variety of functions across pharma: for investment decisions in R&D and business development projects, for demand & supply planning in manufacturing, to decide on promotional expenditures in marketing, etc.
CELforPharma’s faculty member Gary Johnson, author of Sales Forecasting for Pharmaceuticals: An Evidence Based Approach, estimates that the direct costs of inaccurate sales forecasts in pharma could be in the order of 20% of sales!
To test your knowledge of pharma sales forecasting, we designed a quiz – see below – based on Gary’s The Pharma Forecasting Course. The answers with explanations are below. Just reading this page will make you aware of the challenges in producing evidence-based forecasts for pharmaceuticals and raise your alertness when a colleague submits a sales forecast to you!
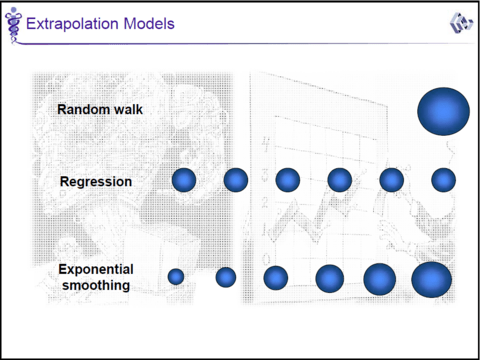
1) Which of the following is NOT an extrapolation technique?
A. Regression
B. Random walk
C. English curve
D. Exponential smoothing
2) Which forecasting technique measures the likeability of different product profiles by assuming that products have different performance levels on a number of key attributes?
A. Target product profiling
B. Conjoint analysis
C. Unaided awareness tracking
3) In 1981 the established ACE inhibitors, in order of launch, were:
I. Captopril II. Enalapril III. Alalcepril IV. Delapril
Using Zipf’s law, what would the forecasted market share be for Alalcepril?
A. 33%
B. 16%
C. 12%
4) What is the typical shape of the marketing advertising response function?
A. R shaped
B. Linear
C. S shaped
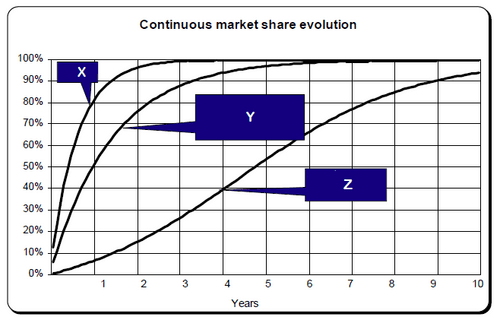
5) What type of product typically has uptake curve X?
A. A product with a new mode of action
B. A me-too product
C. A generic
Answers:
C, because all other are extrapolation techniques:
In a regression, every historical data point is being given the same weight.
In a random walk forecast, the last data point gets all the weight.
In an exponential smoothing model, the last data point gets more weight than the previous and so on.
Image
B.
Conjoint analysis is a useful market research technique that is often used in the pharmaceutical industry and the main way in which clinical profiles are related to their sales potential. Conjoint measures the likeability of product profiles. It approaches the question of how much customers like different products in a very particular way by assuming that products have different performance levels on a number of key attributes, e.g. median overall survival for an oncology product.
B.
Zipf’s law is an empirical law that refers to the fact that many systems follow the same simple pattern. For example: the most common used word in an English book is “the”, and it is twice as common as the next most common word “of”. It is three times as common as the next word “and” and so on… This can also be applied in pharmaceutical forecasting. Gary Johnson uses the example of the ACE inhibitors in his book and the training. And the market share for the third launched product using this model will be (1/3) / (1+1/2+1/3+1/4) = 16%.
However, this model does not take other marketing variables such as product profile and marketing spend into account. If a later to launch product has a better profile etc., it can gain a much larger market share than predicted by Zipf’s law. An example is Humira which was third to launch in its drug class but became the market leader and the world’s biggest selling pharmaceutical.
A.
R-shaped: The overwhelming majority of published studies looking at the advertising response function for consumer goods suggest an r-shaped rather than an s-shaped curve or a linear curve. The experience at Inpharmation and many other leading consultancies shows that the same applies for pharmaceutical products.
C.
Generics are very similar to already existing products and the product will be taken up quickly. For me-too products (typical Y curve), the level of differentiation is larger, hence physicians will take longer to start prescribing the product. A molecule with a new mode of action will result in an even slower uptake curve (typically curve Z).
However, there are some risks with using analogue models as a lot will be determined by the attributes of the product and the level of unmet need.
🎓 If you want to learn about:
- The six proven principles for producing the most accurate forecasts.
- When and how to use epi-based, patient-based, and sales-based forecasts.
- The evidence-based forecasting techniques for pharmaceuticals and how to use them.
- How to correctly integrate market access into your forecasts.
- How to deal with pharma-specific issues like lines of therapy, co-prescription, etc.
- The future impact of new technologies (e.g., AI and Big Data) on pharma forecasting.
👉 Attend Gary Johnson’s and Sam Johnson’s highly praised 2-day course:
The Pharma Forecasting Course
With Gary Johnson & Sam Johnson

